35 Most Important Business Stats For Startups Entering 2020!
Featured Image: iStock/HAKINMHAN
2020 is not just the start of a new year, it’s the beginning of a new decade. A decade you’ve entered with hopes of achieving greater success in your business. How can you do that? By devising solid business and marketing strategies, founded on facts and numbers, which can be documented and analyzed to give you a real sense of your business trajectory.
Keeping that in mind, we have collected here some really useful statistics and data points that can provide you a solid foundation on which to structure your marketing and business strategy.
We have segmented the stats into seven main areas of business:
- Ecommerce
- Mobile Commerce
- Shopping Cart
- Customer Experience
- Email Marketing
- Social Media
- Video Marketing
The last one will be further categorized into content marketing, social media marketing, video marketing, and email marketing.
So without further ado, let’s see what the numbers say.
Ecommerce Statistics
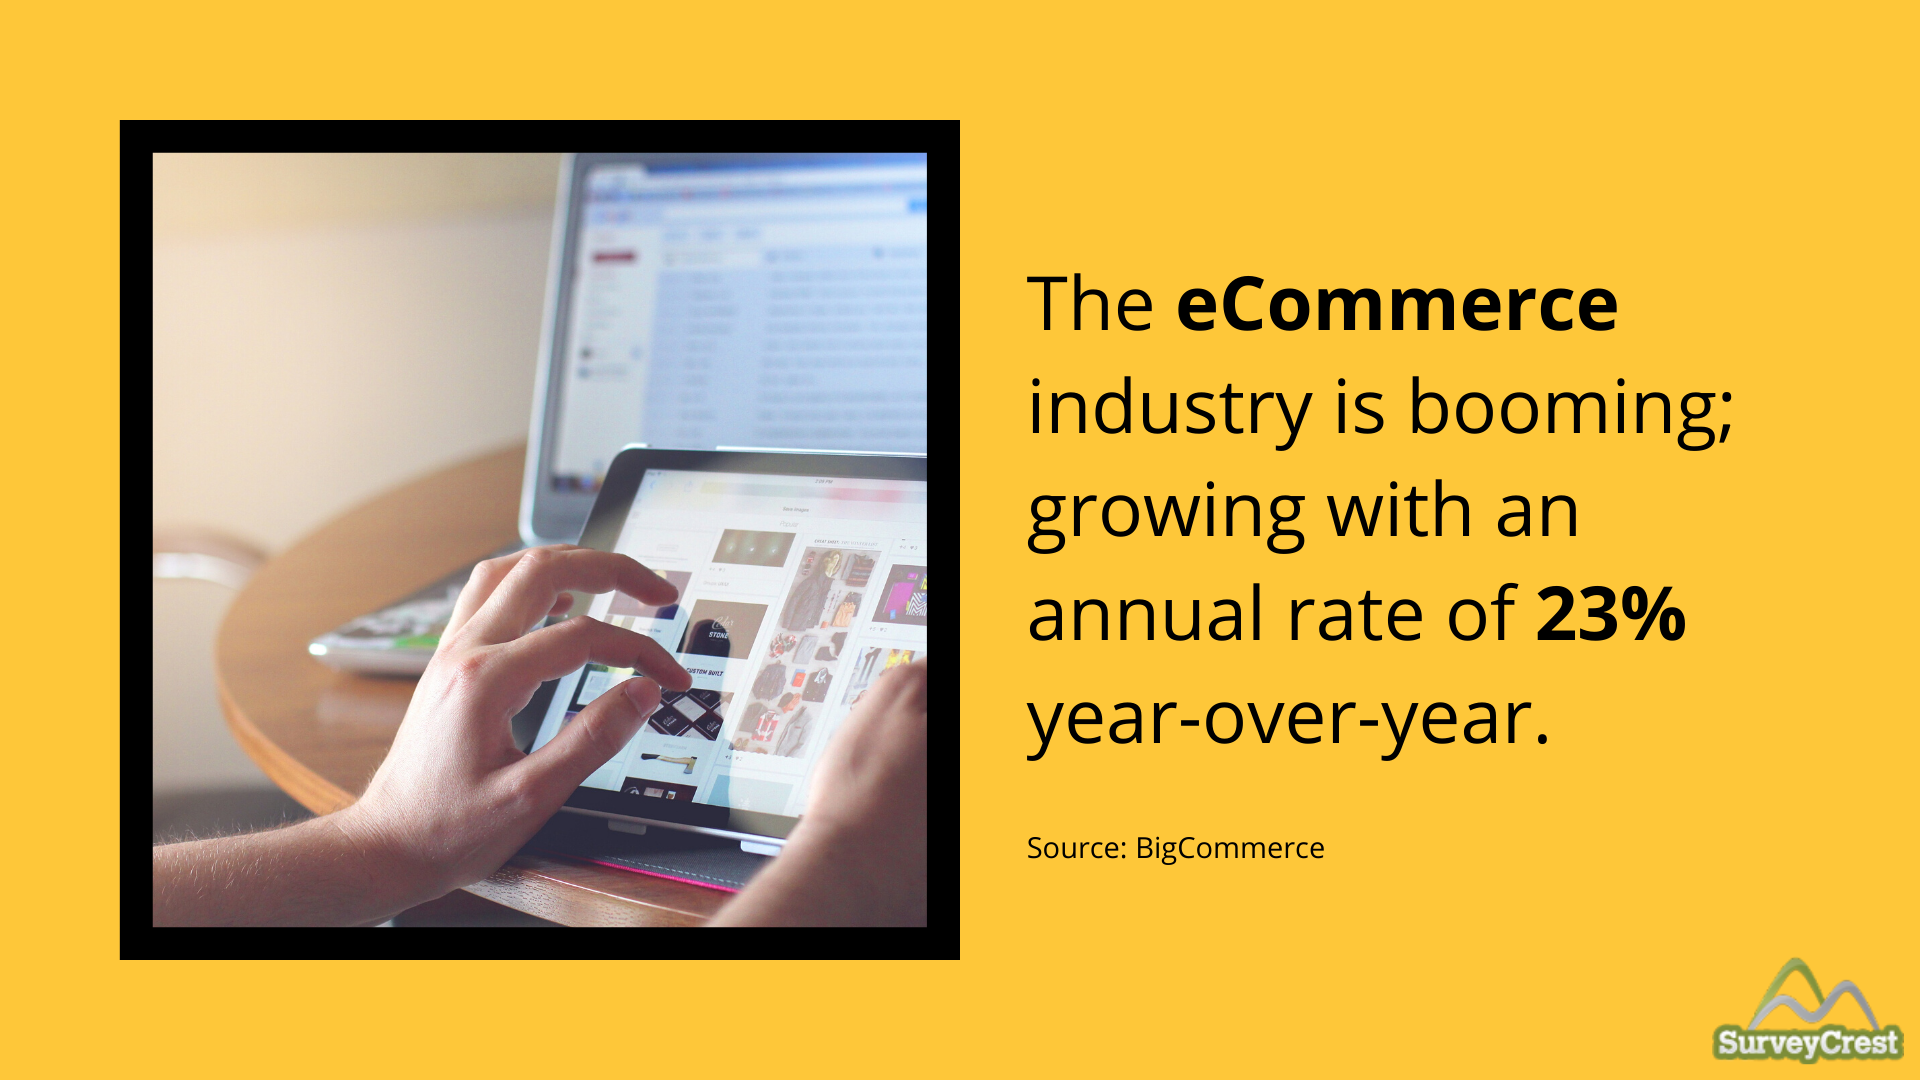
- The e-Commerce industry is booming; growing with an annual rate of 23% year-over-year.
- 93.5% of global Internet users have made purchases online and it’s estimated that by the year 2040, 95% of all purchases made will be through online channels.
- With the above stat still fresh in your mind, tell us how strange you find the fact that 49% of American small businesses still don’t have a website.
- But all may not be lost. If you have your brand present on Amazon, you may still be okay. 59% of Millennials prefer to visit Amazon first when doing shopping online.
- Shopping on Amazon is so common and so frequent that 41% of all online shoppers say they receive an average of 1-2 packages from Amazon every week. For consumers aged 18-25, this number jumps to 50%, and for consumers aged 26-35, this number is 57%.
- What method do they use to pay for it? Debit cards are still the most popular payment methods for US consumers. 30% of them use their Debit cards to make online payments compared to 28% who use various electronic payment solutions.
Mobile Commerce Statistics
- Sale conversion rates from mobile apps are 3 times higher than mobile websites – encouraging you to start investing in your online store app and sell services online.
- In the holiday season, these stats go even higher. More than a third of all US holiday shoppers – 40% – made their holiday purchases online in 2019.
- But if customers didn’t have a good experience on your mobile store the first time, they are 62% less likely to ever purchase from you again.
- Mobile commerce also plays its part even when your customers are in your physical store. 62% of them look upon price comparisons before making a purchase there.
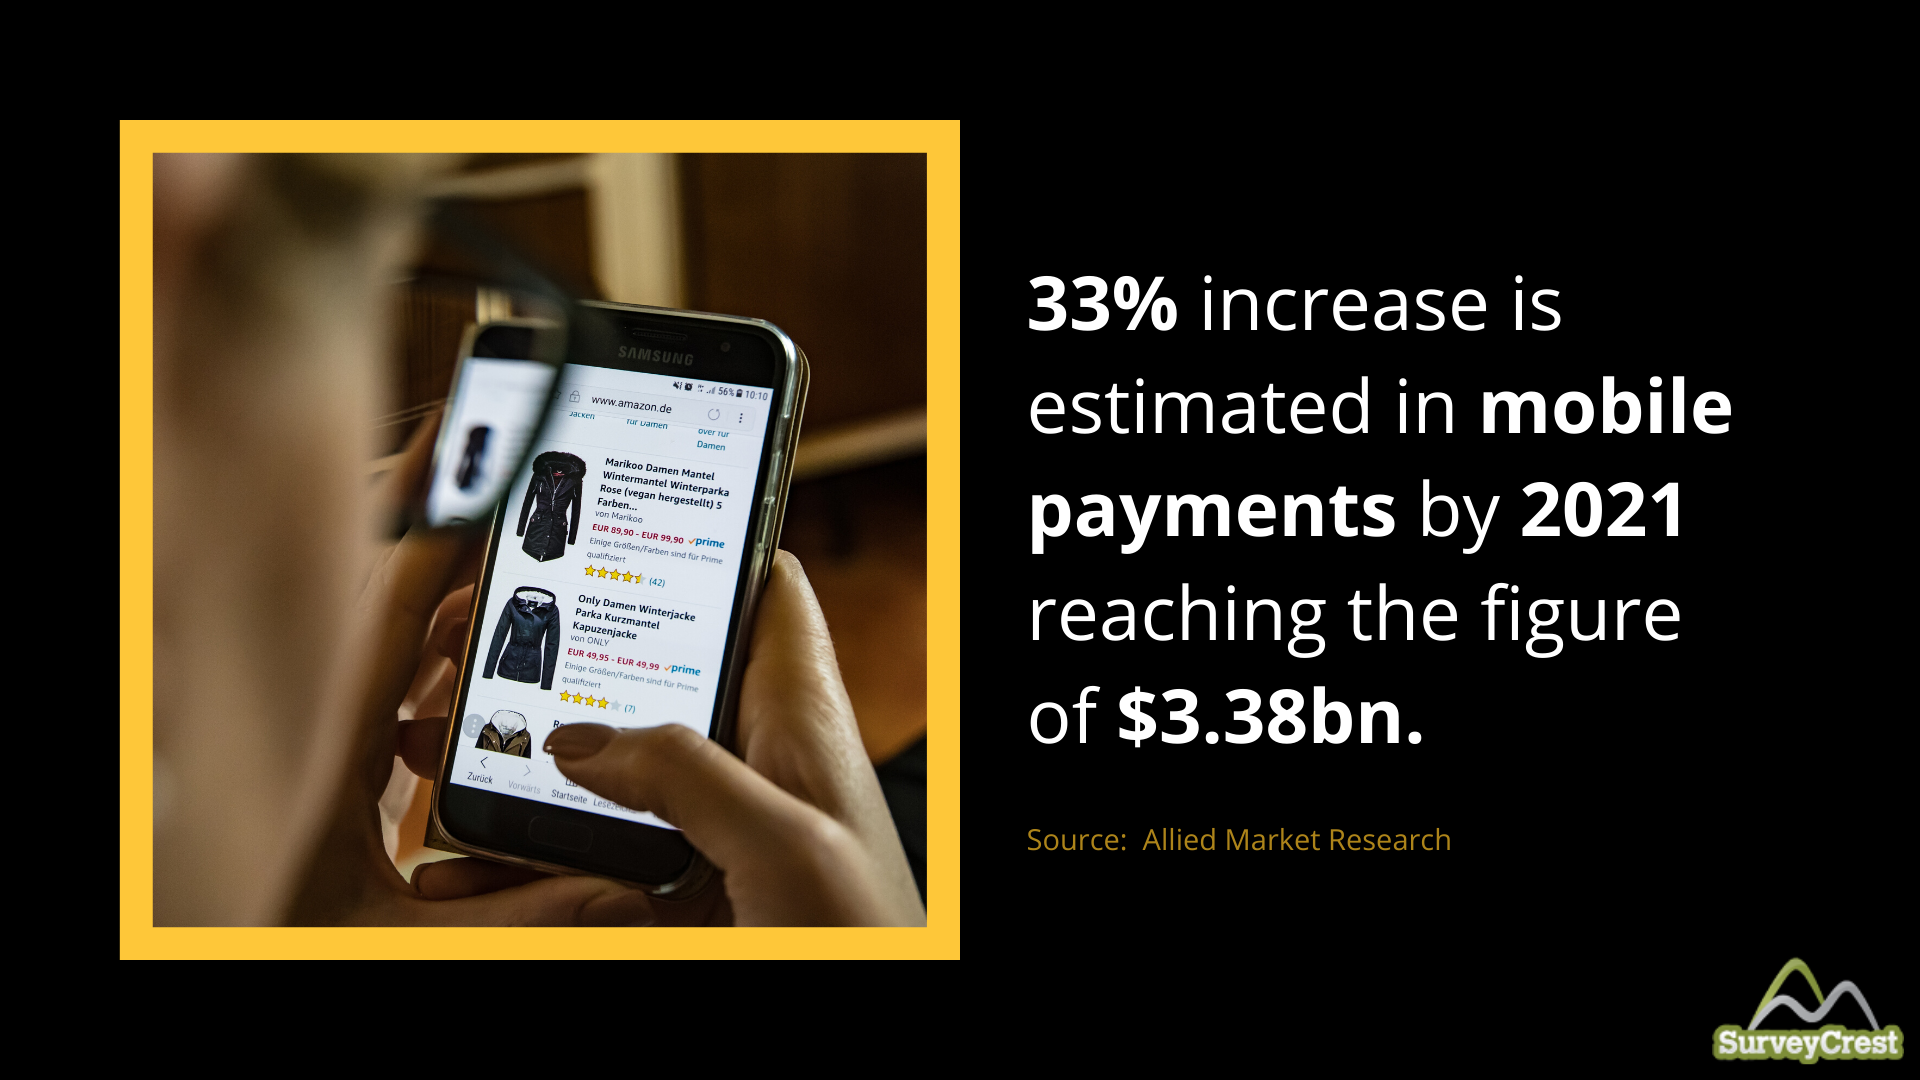
- 33% increase is estimated in mobile payments by 2021 reaching the figure of $3.38bn.
Shopping Cart Statistics
- Cart abandonment rates fairly average across regions, staying between 70-76% ranges. Specifically for North America, this rate is 74% across industries.
- In terms of specific industries, retail has a cart abandonment rate of 74.58% while travel (81.31%) and airline (87.87%) are worse hits.
- People shopping on mobile devices are more likely to leave their transactions incomplete. 78% of mobile phone users and 70% of tablet users abandon their carts mid-purchase.
- 23% of US customers abandon a purchase if the checkout process seems too long to them or asks them to create an account. To curb these high rates, business owners need to make the checkout process easier and smoother and allow guest check-outs.
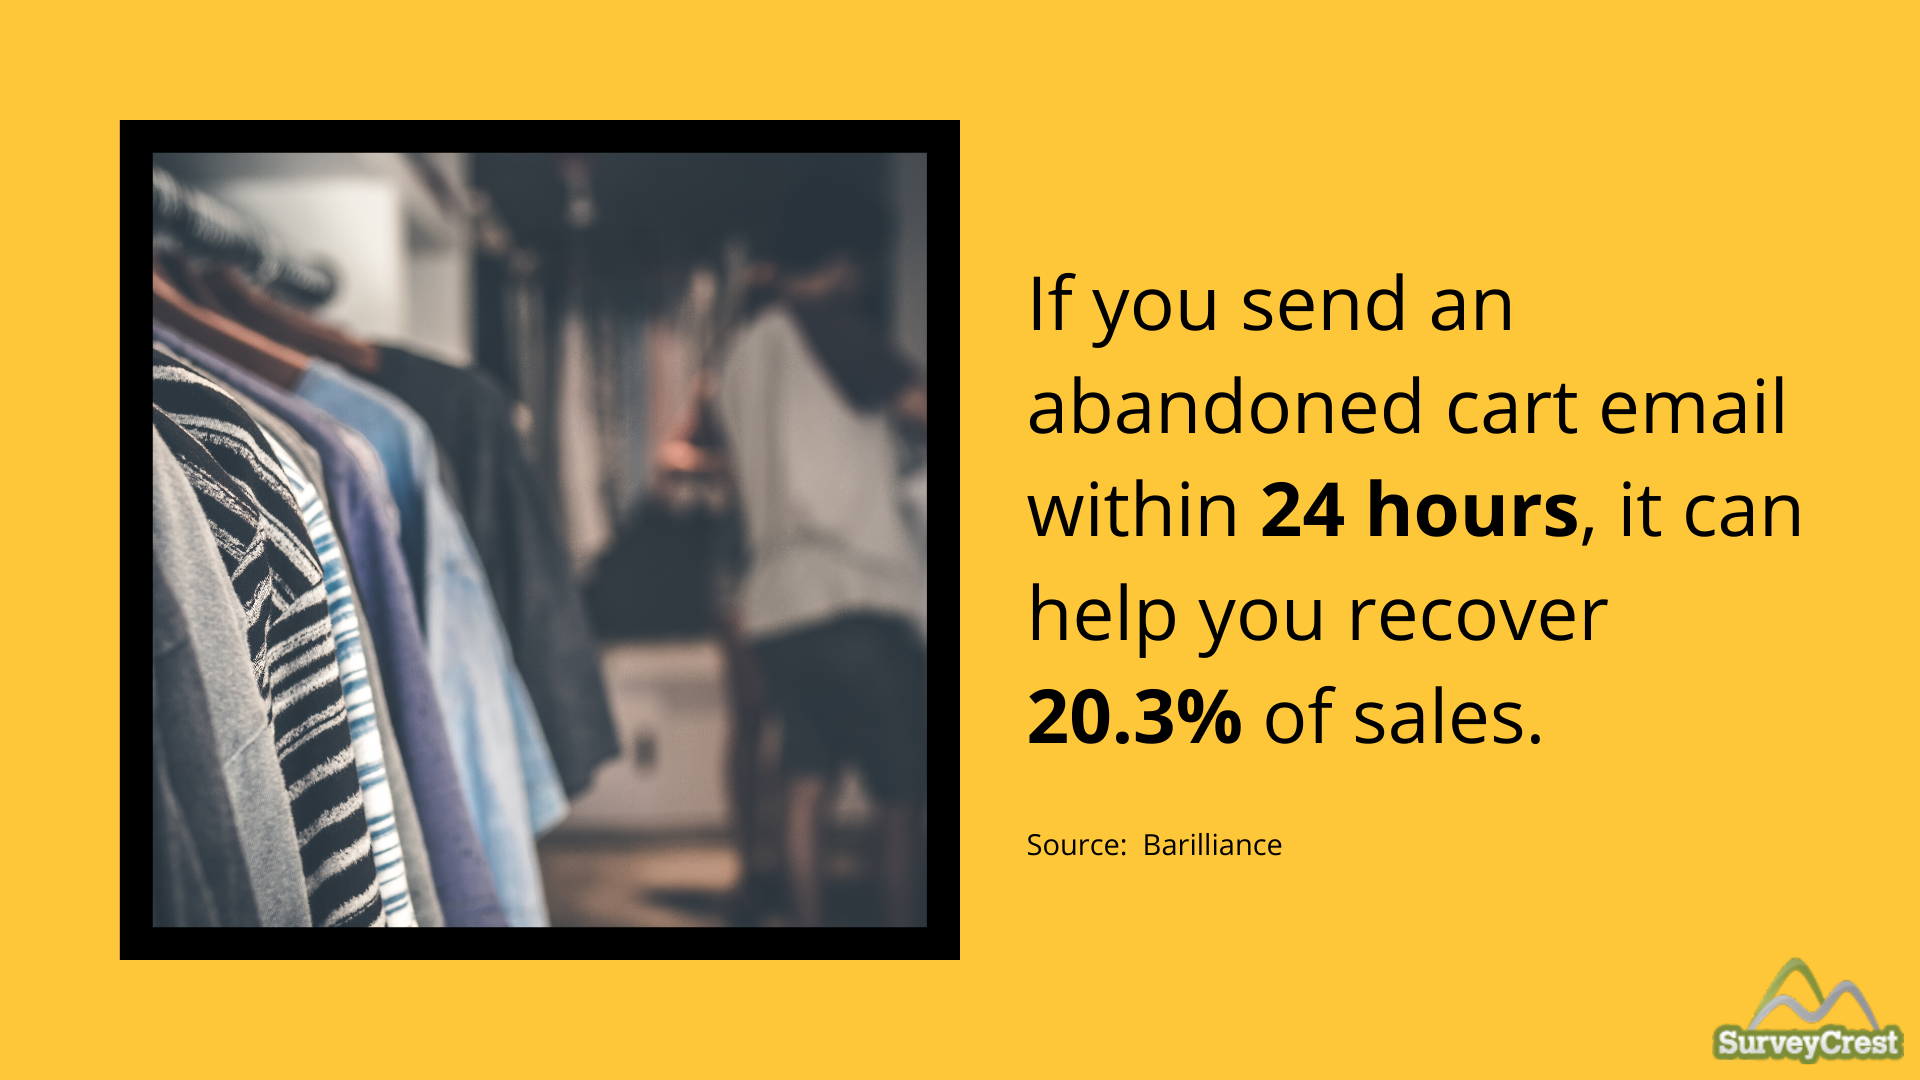
- If you send an abandoned cart email to the customer within 24 hours, it can help you recover 20.3% of sales.
Consumer Experience Statistics
- By the end of 2020, customer experience will emerge as the biggest brand differentiator than either price or product.
- With improved customer experience, a 33% increase in customer retention is reported; 32% in customer satisfaction, and 42% in cross-selling and upselling.

- 86% of buyers are willing to pay more for a better, more personalized customer experience.
- 49% of buyers make impulsive purchases after they receive a personalized customer experience.
- For better customer experience, mobile responsiveness is the key. 57% of customers admit to not recommending a brand if it’s mobile website design wasn’t up to the mark. 50% say they’ll stop visiting it altogether.
Email Marketing Statistics
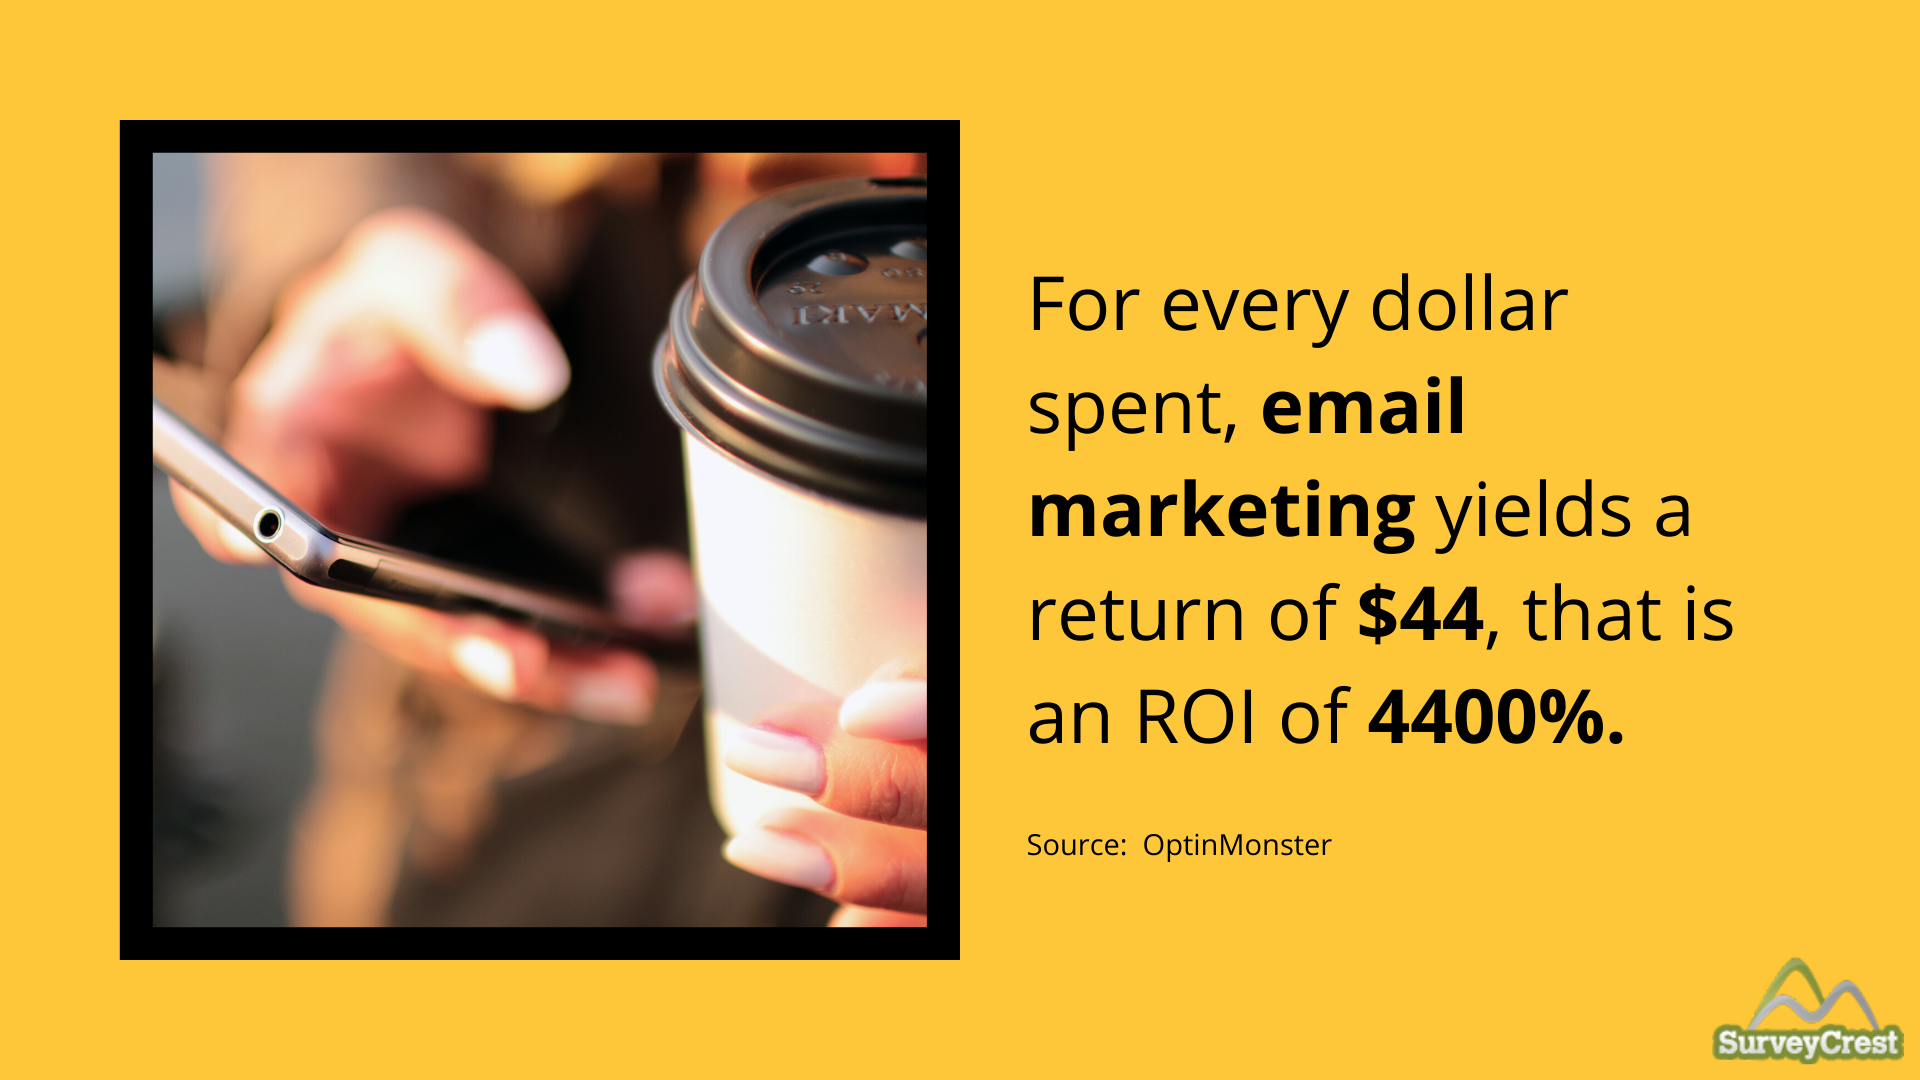
- In terms of ROI, email marketing is the winner. For every dollar spent, it yields a return of $44. In other words, an ROI of 4400%.
- And that’s because 61% of customers prefer that brands contact them via emails compared to other forms of communication, including social media.
- If you’ve got a subscribers list, try sending them a campaign email. It’s noted to drive a 760% increase in revenue.
- What kind of emails work the most for the purposes of email marketing? Transactional emails are opened 8x times more than any other type of email and make 6x more money. Abandoned cart emails also get opened 45% times on average.
Social Media Statistics
- Your online store with a social media presence is expected to make an average of 32% more sales than a store that doesn’t have a social media account.
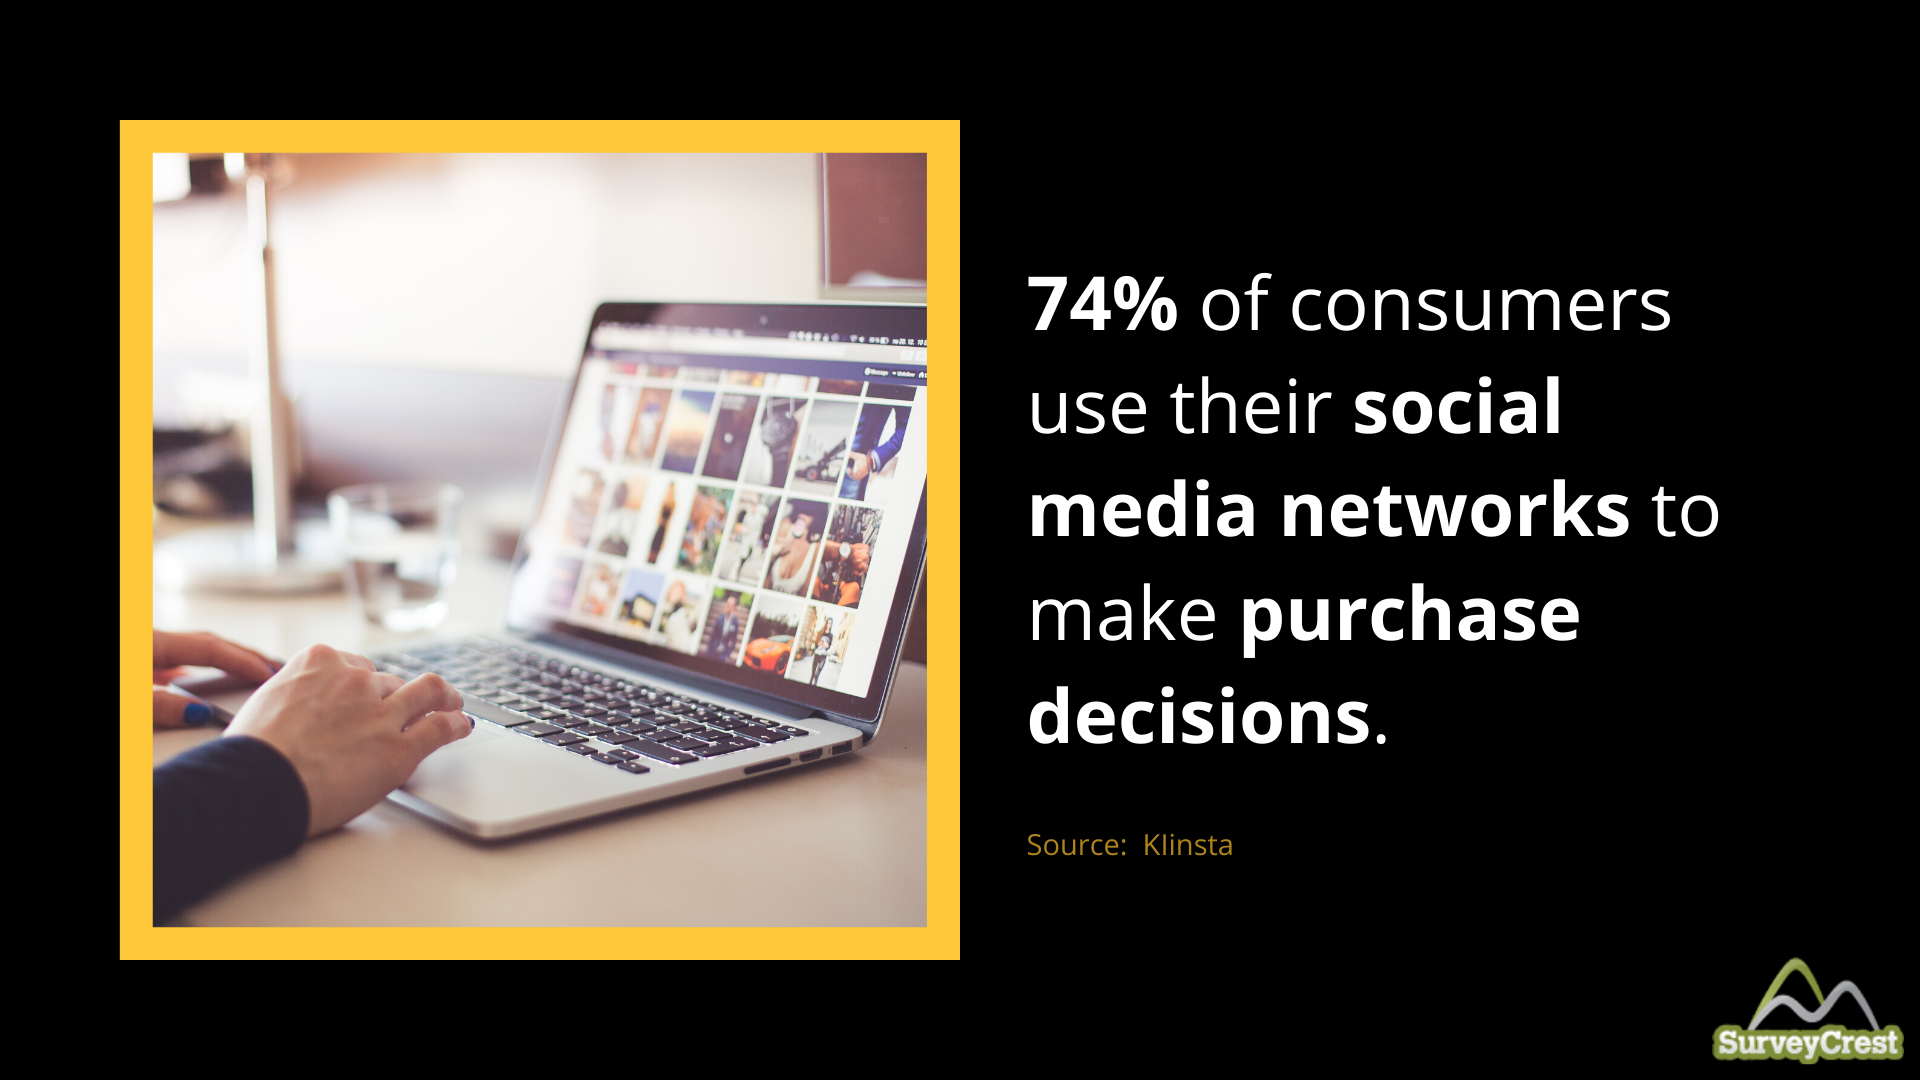
- Why? Because 74% of consumers use their social media networks to make purchase decisions.
- To make the most of it, ensure that your social media posts accompany a stunning image. Such posts get 53% more Likes, 104% more comments, and 84% higher click-through rates.
- In the social media marketing world, Facebook is your best bet. 85% of social media site orders are generated through Facebook.
- Instagram is the closest second. 75% of Instagram users take action (such as clicking a link that takes them to a website) after seeing an ad on their feed.
Video Marketing Statistics
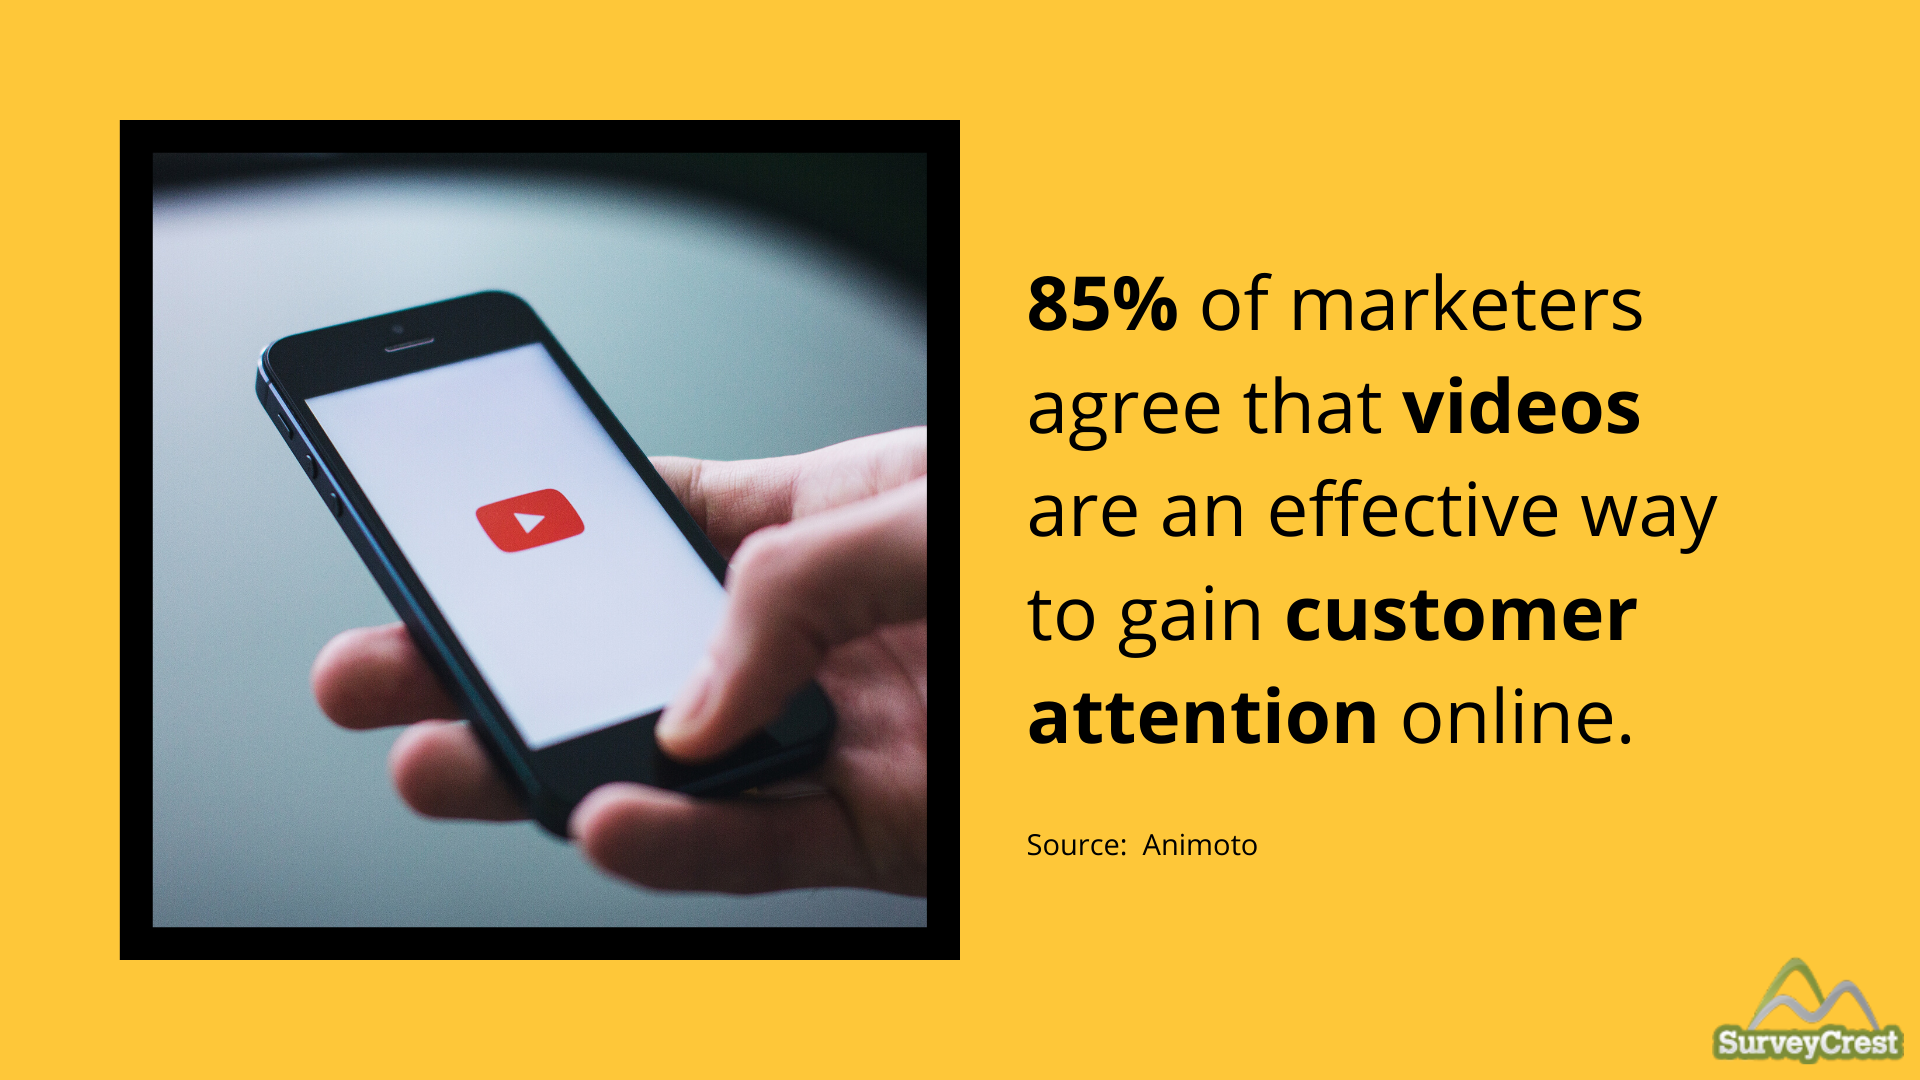
- 85% of video marketers agree that videos are an effective way to gain customer attention online.
But how effective?
- As per the viewers, videos help them retain 95% of a message compared to other forms of communication.
- They also said that compared to other ad forms, videos are the number 1 reason for how they discovered a new brand that they later purchased from.
- Videos also help users gain an understanding of how a product or service works. 95% of video marketers acknowledge that videos have helped users understand a brand’s product or services more.
- And what’s more? Viewers are willing to share their newfound understanding and discoveries with their networks. 83% of consumers said that if they enjoyed a video, they’d consider sharing it with their friends.
There You Have It!
Well-researched and hand-picked stats to make your new business enter 2020 with a high aplomb. To keep it simple, make customer-experience your mantra for 2020 and you’ll be golden.

Kelvin Stiles is a tech enthusiast and works as a marketing consultant at SurveyCrest – FREE online survey software and publishing tools for academic and business use. He is also an avid blogger and a comic book fanatic.


